Overview
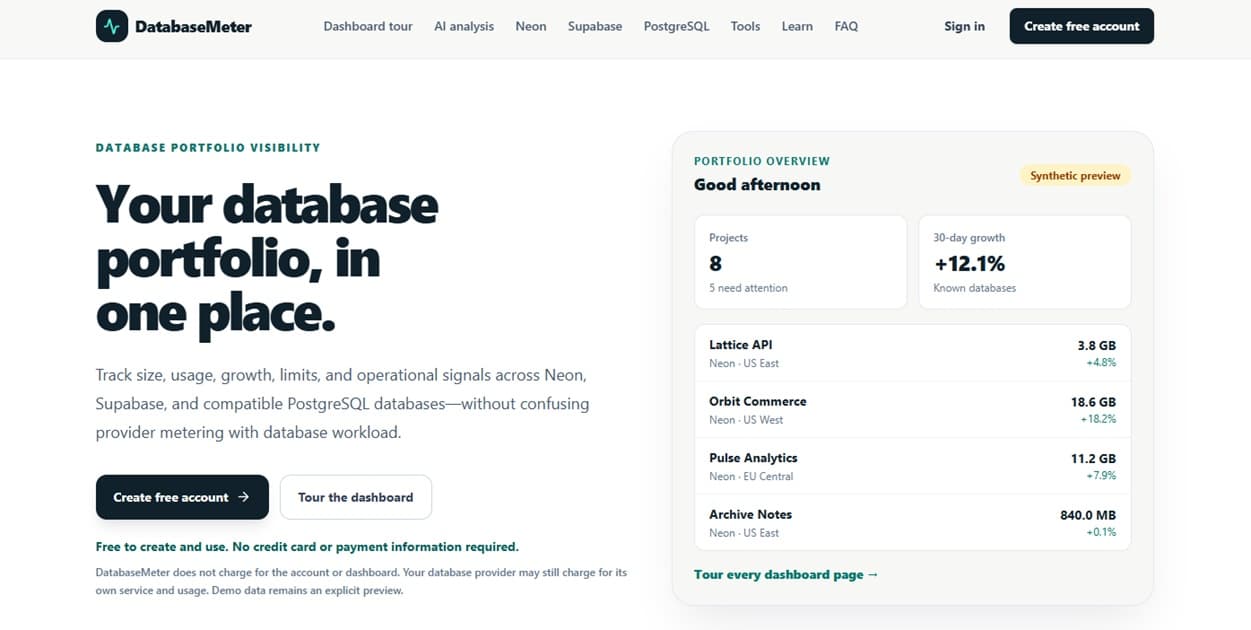
DatabaseMeter is a database monitoring and learning site for Neon, Supabase, and compatible PostgreSQL databases. It brings database projects into a source-aware portfolio view that tracks size, usage, growth, limits, synchronization state, operational signals, and optional PostgreSQL telemetry. The site emphasizes preserving the meaning of each source rather than treating unlike provider metrics as interchangeable. Accounts and dashboard access are free to create and use, while provider service charges remain separate.
What you can explore
The public site includes a dashboard tour built with clearly labeled synthetic examples, plus pages for Neon, Supabase, and PostgreSQL monitoring. DatabaseMeter can present database and relation size, growth trends, provider usage or resource evidence where available, sessions, aggregate workload statistics, alerts, synchronization diagnostics, planning estimates, and opt-in weekly reports. Public tools include a PostgreSQL health check, query-counter analyzer, Neon CU-hours calculator, database growth calculator, Supabase usage calculator, egress calculator, and a Neon-versus-Supabase comparison. The PostgreSQL Learn Center covers topics including database size, growth, WAL, pg_stat_statements, index size, sequential scans, pg_stat_activity, connection pooling, idle-in-transaction sessions, dead tuples, autovacuum, cache and I/O statistics, and managed PostgreSQL monitoring.
Who it is for
DatabaseMeter says it is built for developers and small teams that want practical operational evidence without a heavy observability rollout. It is also useful to PostgreSQL operators who want source-backed explanations, safe inspection guidance, and tools for understanding measurements before making changes. Monitoring credentials are handled server-side, and the stated collection model excludes application table-row contents and SQL text.
AI personas and guides
The verified AI persona is the DatabaseMeter Analyst, described as a calm, evidence-first PostgreSQL and managed-database operations analyst. Its optional AI analysis uses predefined operational questions and a user-selected database scope rather than unrestricted chat. It can summarize health, explain changes, highlight growth, capacity, compute, connection, workload, monitoring-gap, and cost-planning signals, cite supplied evidence, state uncertainty, and suggest safe next steps. The analyst is advisory and read-only: it cannot run SQL, edit a database, change provider settings, or execute recommendations.